
The Sharpe Ratio (“SR”) does not consider sharp drawdowns, while Smart Sharpe Ratio does.
Sharpe Ratio is one of the most used metrics for Asset Analysis in the investment industry. The ratio simply measures the excess return over volatility; hence it does not forecast the future. The higher the Ratio, the better the performance. Anything below 1 is considered sub-optimal, while anything above 2 is regarded as good, and above 3 is excellent.
However, the SR has a downside showcase by the graph below.
Graph 1: 2020 Performance of American and Chinese Long/Short Hedge funds
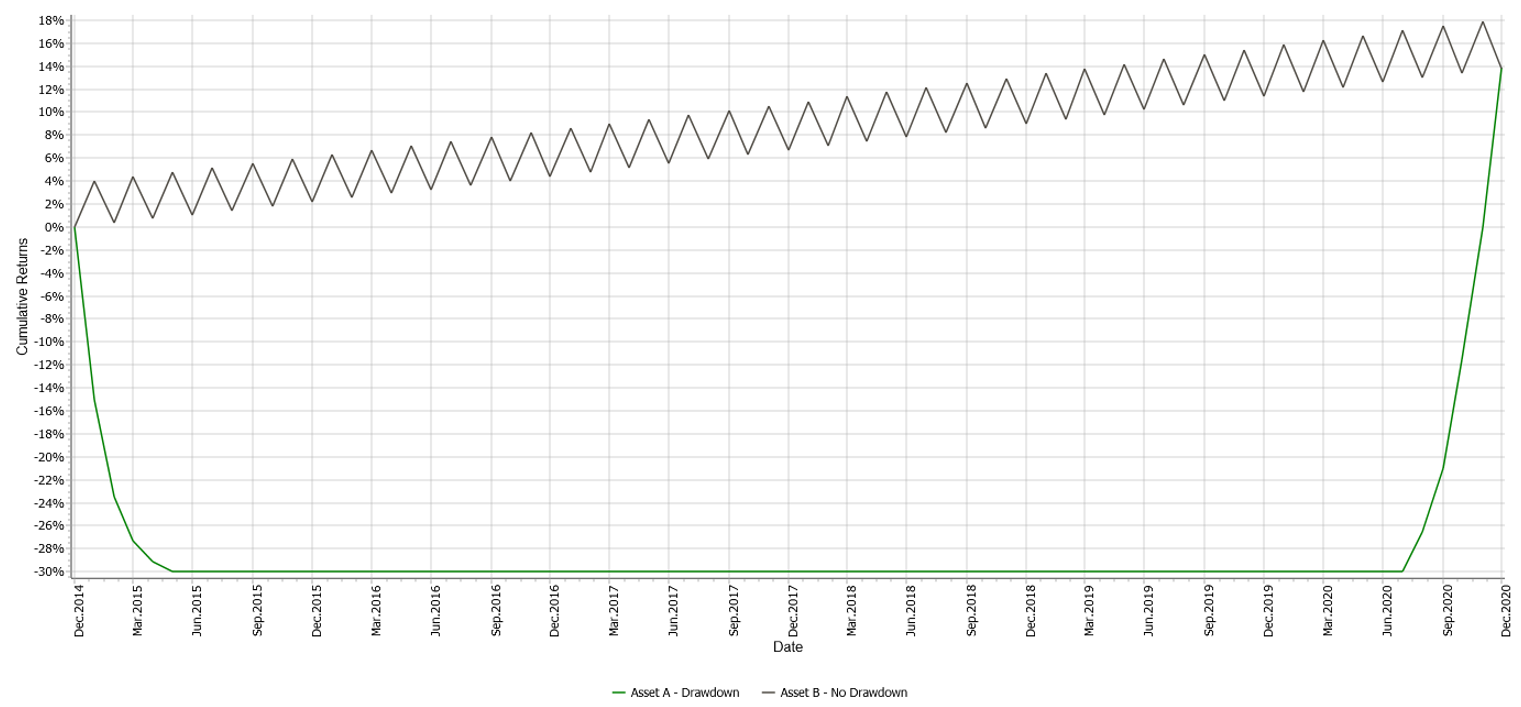
On the one hand, asset A has a hefty downfall at the beginning of Dec 2014 only to come back up at the end of Jun 2020. On the other hand, asset B has steady growth with some small fluctuations over the years. However, if we only measure the SR for the two assets, we will get the same ratio for both despite the staging distinctive performance throughout the period.
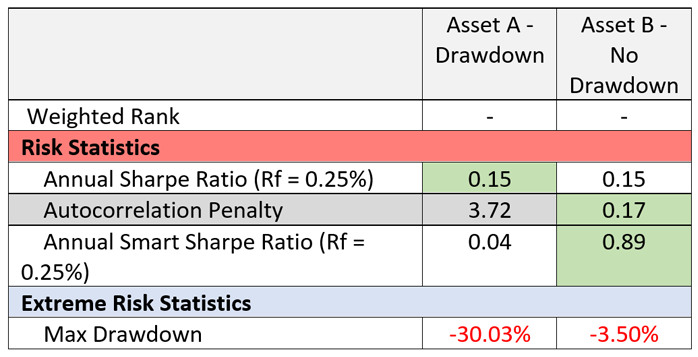
Table 1: Comparison of key metrics between Asset A and Asset B
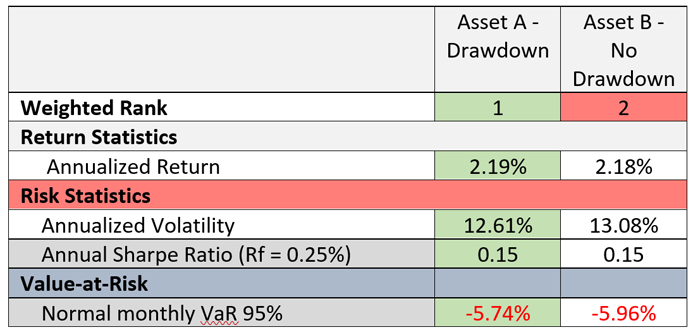
The table above shows that Asset A has a slightly higher annualized return, lower annualized volatility and lower monthly VaR. Despite performing better at these three metrics it has an equal SR with Asset B.
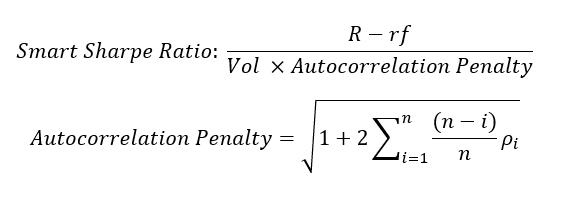
Smart Sharpe Ratio differs from the SR by including an Autocorrelation Penalty in the denominator. ρ_i are the correlation coefficients of the timeseries and its lags. A fund with high Autocorrelation Penalty will have a higher likelihood of drawdowns due to the tendency to propagate negative shocks in the timeseries.
Let’s compare the two assets again using the Smart Sharpe ratio this time. This time we can see that the ratio reflects the more stable performance of Asset B.
In conclusion, while SR is a widely used ratio it should be taken with a grain of salt because it doesn’t account for the drawdown. The Smart Sharpe Ratio allows to account for autocorrelation in a time series. Smart Sharpe ratio would be more suitable than the conventional measure for investors that aims to avoid high drawdowns (i.e., Madoff and illiquid fixed income funds).
N.B. This article does not constitute any professional investment advice or recommendations to buy, sell, or hold any investments or investment products of any kind, and should be treated as more of an illustrative piece for educational purposes.
To trial a truly powerful and comprehensive analytic software for investment decisions, fund allocation, and our new, innovative digital due diligence visit alternativesoft.com , call us on +44 20 7510 2003, or email us information@alternativesoft.com
71 Carter Lane, London
EC4V 5EQ
+44 20 7510 2003